Fossil-fueled industrial boilers are a major source of air pollution that emit high volumes of greenhouse gases and conventional pollutants. Evergreen and Sierra Club’s May 2025 report, Embracing Clean Heat: Opportunities for Zero-Emission Industrial Boilers, presented the case for electrifying these industrial boilers. The report also presented a first-of-its-kind dataset of 14,000 industrial boilers in all 50 states and Puerto Rico.
That dataset details the shocking array of air pollutants these boilers produce, including particulate matter, lead, and hydrochloric acid. According to the American Lung Association report Clean Heat, Clean Air—the analysis for which draws heavily on the dataset we present here—polluting industrial boilers are projected to cause 77,200 pollution-related deaths, 33.2 million asthma attacks and 13 million lost school days by 2050. And tackling that immense threat first requires understanding where the pollution is coming from.
Interactive Maps (Best For Desktop)
The interactive maps below present Evergreen’s dataset in a new format, with an easily navigable state-by-state breakdown of key takeaways, a deeper-dive map with advanced filterability, and a set of factsheets for highlight states. They’re a tool for state agencies and advocates to better understand local challenges, pull data on major pollutants, and see how boiler pollution frequently disproportionately affects disadvantaged communities.
For instructions on how to use these maps, read the Information tab on the right of the map or watch the video tutorials linked below the maps. We recommend using these maps on a desktop device.
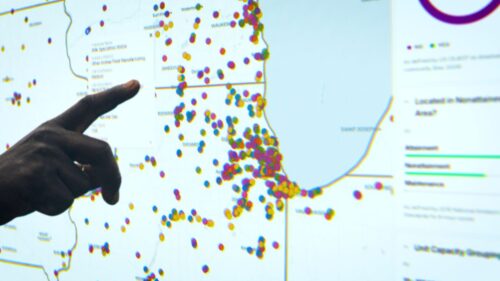
State-by-State Data Highlights
Video Tutorial (State Highlights) | Fullscreen Map (State Highlights)
In addition to the national data summaries boiler maps above, Evergreen has produced tailored state-specific maps. State maps can provide finer-grained insights into regional trends, feature state-specific geodata (e.g., the boundaries of California’s air management districts), and lay the foundation for deeper dives into state permitting data. Evergreen is available to build tailored resources for state agencies and advocates. A sample of our work includes:
- California Map and California Factsheet (PDF)
- Colorado Factsheet (PDF)
- Illinois Factsheet (PDF)
- Maryland Map and Maryland Factsheet (PDF)
- Michigan Map and Michigan Factsheet (PDF)
- Minnesota Factsheet (PDF)
- New York Factsheet (PDF)
- Pennsylvania Factsheet (PDF)
- Wisconsin Factsheet (PDF)
National Map of Industrial Boilers
Video Tutorial (National Data) | Fullscreen Map (National Data)
The National Map of Industrial Boilers includes average emissions data for the nearly 14,000 industrial boiler units identified through Evergreen’s analysis of National Emissions Inventory data. The map can be filtered in the sidebar by state, industry, company, location within a disadvantaged community, and more. We recommend that state policymakers and advocates explore the map and its many variables to discover trends relevant to their work. We have also assessed the national landscape to develop a set of key takeaways.
Main Takeaways from the Industrial Boiler Dataset
Download Our Full Report and Contact Us
For more information on the legal authority states have to set emissions limits on industrial boilers, the costs and benefits analysis for them to do so, and case studies of what boiler electrification can look like in practice, download our full report: Embracing Clean Heat: Opportunities for Zero-Emission Boilers.
Evergreen Action is also available for ongoing consultation on this dataset and its implications for every state. If you want to learn more or request additional information on any state’s boiler landscape, please reach out to policy@evergreenaction.com.